Algorithms & Charts |
An algorithm is a description of how to carry out a process. An algorithm lists the steps that must be followed to complete the process. Algorithms can be described using a language such as English. Here is an algorithm which describes how to make a telephone call :
Descriptions like this are often ambiguous and open to misunderstanding. Therefore various formal methods of describing algorithms have been developed. The simplest methods are the flowchart and the system flowchart.
A flowchart consists of a sequence of instructions linked together by arrows to show the order in which the instructions must be carried out. Each instruction is put into a box. The boxes are different shapes depending upon what the instruction is. The main four types of box are :

Flowcharts are often used to describe in detail algorithms that will be carried out by a computer. When a computer carries out an algorithm the computer is said to execute the algorithm. Execution is also sometimes referred to as running.
Here are some example situations in which flowcharts are often used :
| Control Systems | The operation of a control system can be described using a flowhcart. | |
| Macros | The actions that a macro should execute can be planned using a flowchart. | |
| Computer Programs | Computer programs can be designed by drawing flowcharts to show what instructions the program should execute. |
Sometimes a more general view of how an information system will operate is required. A flowchart for a complete information system would cover many pages of paper and would be very difficult to produce and understand. A more general description of how an information system operates can be given by using a system flowchart.
Flowchart Example One : Simple Greenhouse Temperature Control System
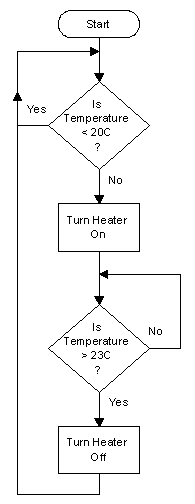
This control system is used to keep a greenhouse warm in the Winter. It keeps the temperature of the greenhouse above 20°C. If the temperature drops below 20°C then a heater is turned on to warm the greenhouse up.
The important components of this system are :
The control system has these input and output devices :
| Input Devices | Output Devices |
| Temperature Sensor | Heater |
The operation of the system is described by this flowchart :

Flowchart Example Two : Macro To Sort A Football League Table
A spreadsheet has been created which shows the league positions of some football teams in a league. Whenever a team plays a match the team's points score and position in the league may change. After each match the league table must be sorted to put the teams in the correct order. The actions required to complete this task in the spreadsheet are :
A macro has been created to automate this process. The macro is described by this flowchart :

Flowcharts describe in detail how a process will be carried out. Sometimes during the development of an information system it is useful to be able to produce a more general description of how a system will work.
A system flowchart shows in general terms the operations that will be performed on information in an information system. The arrows on a system flowchart show the direction that data will flow in around the system rather than the order in which the operations will be carried out.
Many more symbols are used on a system flowchart than on a normal flowchart. These are the symbols that may be used :

A car repair garage uses an information system to produce invoices and keep track of the parts it has in stock. The system uses two files :
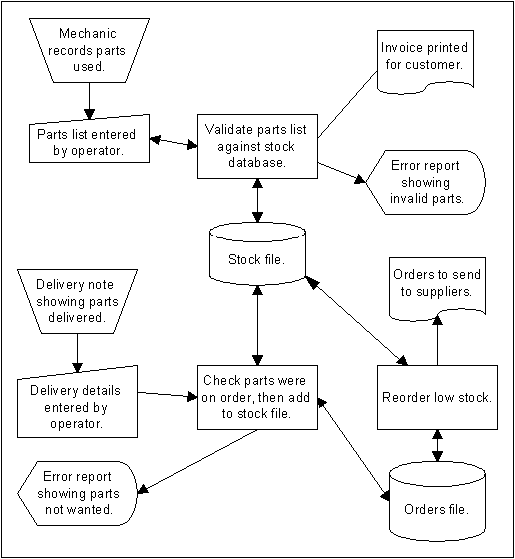
When a repair is completed the mechanic records the parts that were used on a form. These parts are then entered into the computer by an operator. The list of parts that is entered is checked against the stock list to reduce the likelihood of the operator making a mistake. If the operator enters the name of a part that does not exist then an error report is displayed. When the parts list has been entered the cost of the parts is looked up in the stock file and an invoice (bill) is printed for the customer.
Every night the computer system checks the stock file. A report is printed to indicate which parts need to be ordered from the garage's suppliers. Details of any orders are placed in the orders file.
When a delivery of new parts is made to the garage the person making the delivery gives the garage a delivery note. The delivery note contains a list of the parts that have been delivered. The list of new parts is entered into the computer by an operator. If any parts have been delivered that were not ordered then an error report is printed. When an order is delivered the information about the order is removed from the orders file and the stock file is updated.
The structure of this system can be shown using the following system flowchart :

GCSE ICT Companion 04 - (C) P Meakin 2004